 Sprinkler Age A Publication of the American Fire Sprinkler Association
2020 Data Study
Since March 2020, the fire protection contracting industry has been reeling from the impacts of COVID-19. In the early days of the pandemic, when cities and states issued closure orders, the uncertainty was terrifying. The fear made us all question the future of our business—how should we react to the changes?
We examined ServiceTrade account data1 from over 330 fire protection contractors to measure the effects of the COVID-19 slowdown in the U.S. and Canada. In the data, we uncovered strategies companies are deploying to mitigate the lasting impacts of the pandemic on their business and even grow in spite of the tight economic headwinds.
The bad news is reactive service call work is driving significantly less revenue than before the pandemic so you shouldn’t rely as heavily on that type of work. The good news is inspection demand has recovered and, despite lower quote approval rates, there is plenty of opportunity to increase deficiency repair quote volume to drive more high-margin sales. (See Figure 1.)
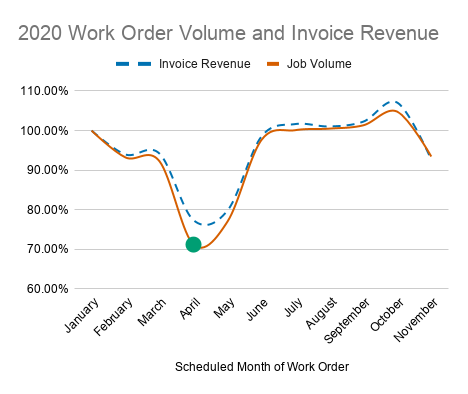
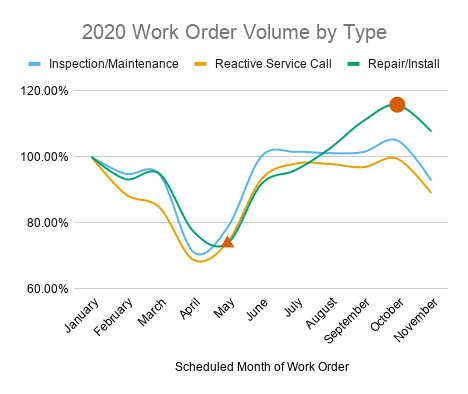
In April, fire protection inspection, testing, maintenance, and repair work order volume dropped 28.8 percent from January levels. This low point is marked with the green circle in Figure 1. By June, work order volume mostly recovered with a dip in November, which happens every year in historical data due to the Thanksgiving holiday. Interestingly, invoice revenue for this cohort of fire protection companies did not decrease as much as work order volume but still dropped by 22.6 percent. When we dig into the data and take a closer look at three different major types of work orders, inspection/maintenance, reactive service call, and repair/install, a couple of interesting trends stand out.
First, the decline in repair and install work order volume was delayed by about a month compared to that of inspection, maintenance, and reactive service call work and was less severe as seen in Figure 2 marked by the orange triangle. Since repairs for deficiencies are typically delayed from the inspections on which they are reported, it’s no surprise that a decline in inspections resulted in a lagging dip in repair volume. Interestingly, unlike other work order types, repair and install work order volume continued to climb well past the point of recovery to 113.4 percent of the January volume at a peak in October as seen marked with the orange circle in Figure 2. An even closer look at reactive service call revenue reveals a curious trend.
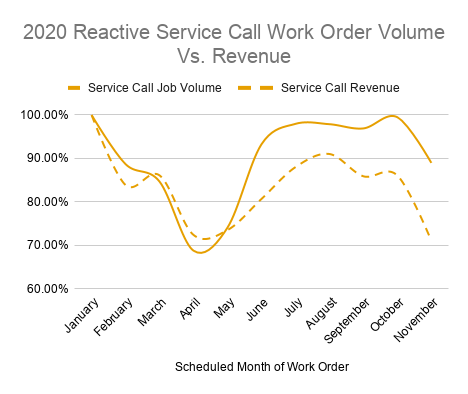
While data shows that revenue tracks closely to the work order volume for inspection/maintenance and repair/install work, reactive service call revenue never fully recovered and seems to be dropping again, as seen in Figure 3. This suggests that the average revenue per reactive service call is much lower than pre-pandemic levels. Moving forward, you should rely less on reactive work to reach your goals and, instead, focus on proactive inspection and repair work to overachieve.
Deficiency Reporting and Quote Performance
Next, we look at the rate at which deficiencies are reported on inspections, what percentage are quoted for repair, and what percentage are approved for repair.
Interestingly, as seen in the solid blue line in Figure 4, the rate at which deficiencies were reported on work orders climbed after May and stayed at levels about 5 percent higher than pre-pandemic levels. The rate at which quotes were created for deficiency repairs, as seen in the dashed orange line in Figure 4, declined in March but quickly climbed above pre-pandemic levels in the second half of the year.
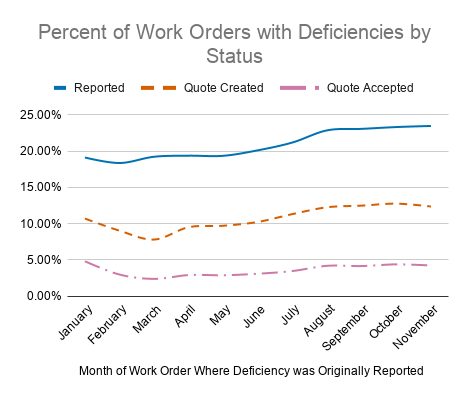
Thanks much in part to the increased rate of deficiency reporting and quoting, the rate at which facility owners and managers approved deficiency quotes (per work order), the dash-dotted pink line in Figure 4, is trending in a positive direction. Though the deficiency quote approval rate took longer to recover, the data suggests that there is opportunity for fire protection contractors who have the capability to report and submit quotes for high volumes of deficiencies. In other words, companies that have the technology and processes to take more shots are going to get more wins.
Figure 4 also suggests there is a backlog of opportunity. Likely, you have a pileup of unquoted deficiencies that were reported during the early days of the pandemic and a backlog of unapproved deficiency quotes worth revisiting with your customers. So, what does the data suggest that you can do to make the most of that backlog and future quotes? For that, we look to quote approval rates for over 270,000 fire protection quotes processed through ServiceTrade from January to November 2020. When we measure the number of ServiceTrade quotes approved in a month divided by the number of quotes submitted to customers in that same month, we can chart a normalized quote approval rate over time.
For all quotes, there was a dip in the normalized quote approval rate during the first couple of months of the pandemic. The normalized quote approval rate mostly returned to pre-pandemic levels in May for quotes under $5,000, as seen in the dashed green line in Figure 5. However, there is a noticeable difference for quotes over $5,000. Historically, quotes over $5,000 are approved at a lower rate, but they are not recovering to pre-pandemic approval rates like quotes under $5,000. as seen in the solid gold line in Figure 5. Just like you, your customers are still recovering and likely sensitive to price.
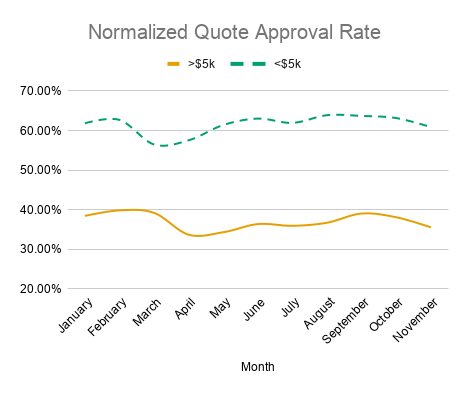
This data suggests you should keep sending repair quotes and focus on the smaller repairs that could prevent more costly breakdowns in the future to help replace your lost workload with planned repairs. Instead of relying on a handful of large quotes to meet your goals, you should systematically crank out smaller quotes under $5,000 to meet the market demand.
At ServiceTrade, we have a saying, “Feelings fool and data rules.” The companies that respond based on data about what’s happening in their business and with their customers will make better decisions than those who have to rely on their gut feelings. We’ve focused here on work order volume, work order revenue, and quote approvals, and if you’re not tracking these metrics, start now.
This data analysis was performed with business analytics reporting available to ServiceTrade customers. Email us at hello@servicetrade.com or call (919) 246-9900 to learn how your service operations can get the visibility needed to deliver better customer outcomes.
FOOTNOTES:
1. Data for December 2020 was not available at the time this article was written.

ABOUT THE AUTHOR: Shawn Mims’s background in the software industry gives him a unique perspective of how technology can solve the complex problems unique to commercial service contractors. In his role as ServiceTrade vice president of product management, Mims adapts consumer and high-tech customer service, sales, and marketing into effective strategies for commercial service contractors. Mims is co-author of Money for Nothing and a popular speaker at the Digital Wrap Conference and at trade association events, including the Virginia Chapter of AFSA.